1 The Edge — why it works
Buyers take control at a level price couldn't pass before
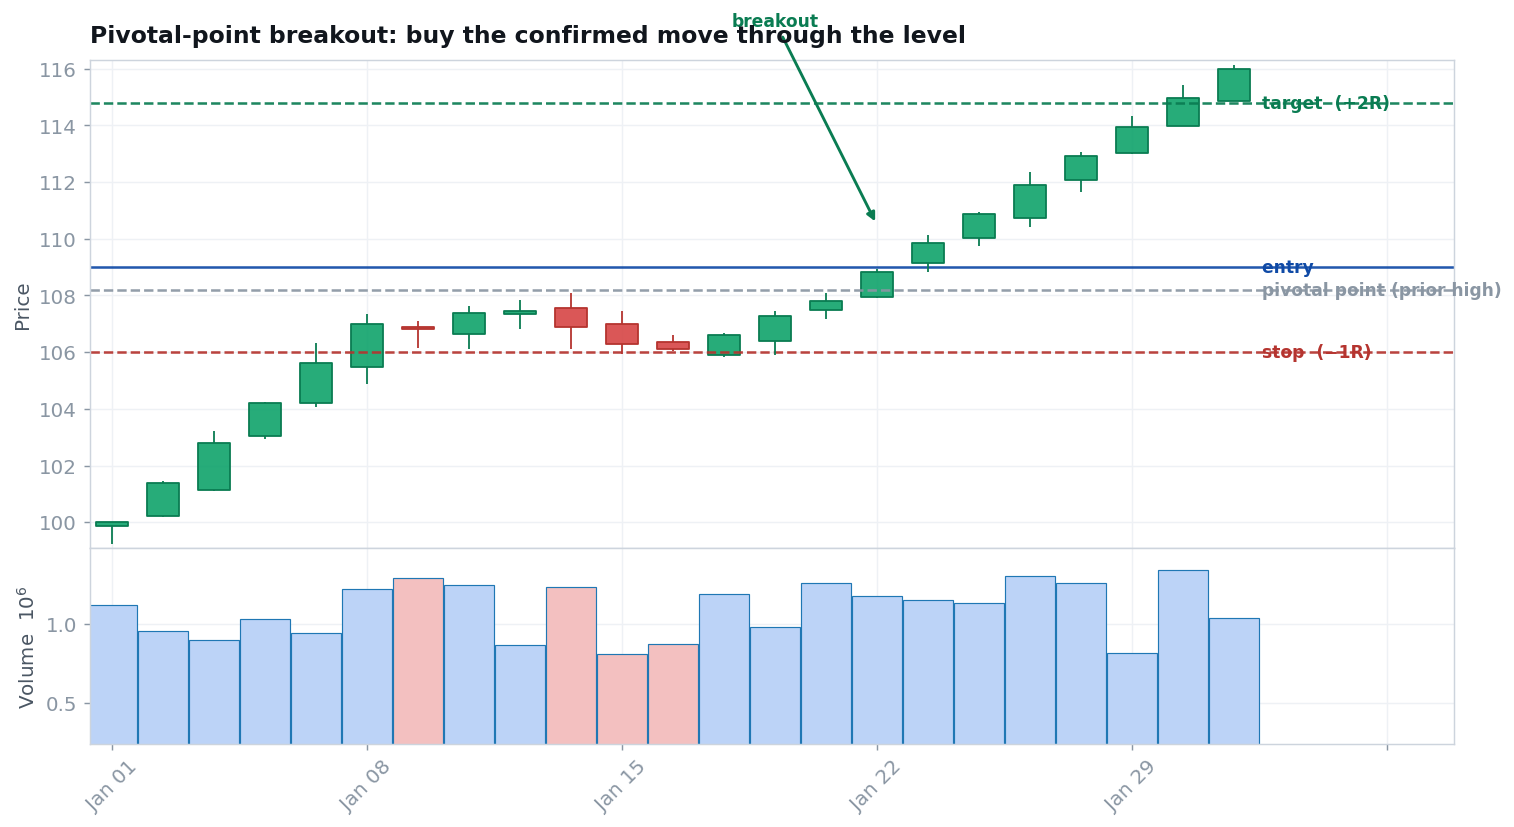
A "pivotal point" is a price the market has repeatedly failed to cross — a round number ($100), a prior high, a multi-week ceiling. While price coils beneath it, sellers are absorbing every rally. The moment price closes decisively above that level, the balance has flipped: the sellers there are exhausted or trapped, and the path of least resistance is up.
The edge isn't that every breakout runs — it's that when one does, it can run far, while a failed one costs you only the small distance back below the level. You're paying a series of small, defined losses for the occasional large, asymmetric win. That asymmetry is the whole game.
2 Where it works — and where it doesn't
Conditions matter more than the pattern
Works best when…
- The instrument is liquid (tight spread, real volume).
- The broader market is trending, not chopping.
- A clean, obvious level lots of traders can see.
- Volume contracts in the base, then expands on the break.
- Price is breaking out from a base, not already extended.
Fails / avoid when…
- Range-bound, low-volatility "chop" — false breakouts everywhere.
- The break happens on weak or falling volume.
- Price is far above the level already (you're chasing).
- Only an intraday poke above, with no decisive close.
- News-driven spike you can't define a sane stop against.
3 Setup checklist
All of these true before you act
- ✓A defined pivotal level. A round number, prior high, or multi-week ceiling price has repeatedly failed to cross.
- ✓A base beneath it. Price has consolidated under the level — ideally with volume drying up.
- ✓Trend & market agree. The stock and the broader market lean up, not down.
- ✓A decisive close above. A full-period close beyond the level — not an intraday wick — ideally on expanding volume.
- ✓A sane stop exists. There's a logical place just below the level/base where you'd admit you're wrong, close enough to keep risk small.
4 The process — entry, stop, size, exit
From signal to managed trade
Entry
Enter on (or just after) the decisive close above the pivotal level. No anticipation — you need the confirmation first.
Stop (invalidation)
Place your stop just below the level or the base low — the point that proves the breakout failed. The distance from entry to stop is your 1R (one unit of risk), defined before you enter.
Position size
Risk a small, fixed fraction of your account per trade (commonly 0.5–1%). Your share count falls out of that — never the other way around.
Exit & management
Aim for an asymmetric target (e.g. a measured move or 3R). As price proves you right, trail your stop up under each new higher low — and, Livermore-style, you may add a smaller position on continuation, moving the stop to protect the whole. Cut fast if it fails.
5 Worked example (illustrative)
One trade, start to finish, in R
| Account / risk per trade | $25,000 · 1% = $250 |
| Entry (decisive close above $100) | $100.50 |
| Stop (below the base) — 1R | $97.40 · 1R = $3.10/share |
| Position size = $250 ÷ $3.10 | ≈ 80 shares |
| Target (+3R) | $109.80 |
| If it works: +3R | + $744 (≈ +3.0%) |
| If it fails: −1R (stop hit) | − $248 (≈ −1.0%) |
6 Honest expectancy
Why < 50% wins can still be profitable
A breakout system can lose more often than it wins and still make money — if winners are larger than losers. That's the whole point of cutting losers at 1R and letting winners reach 3R+.
Example: win 40% at +3R, lose 60% at −1R → (0.40 × 3) − (0.60 × 1) = +0.6R per trade. Positive — but only realized over many trades, with strict risk control. This is an expectation, never a guarantee; real results vary, include strings of losses, and depend entirely on your discipline.
7 Make it yours
Test before you trade
A no-risk validation routine
Find 30–50 historical breakouts on charts you can scroll through. For each, write down — before revealing what happened next — the entry, the stop (1R), and the target. Then reveal the outcome and record the result in R.
Tally your win rate and average win/loss, then compute the expectancy above. If it isn't positive on paper across dozens of samples, it won't be positive with real money. Journal every one — process over outcome.
8 Common mistakes
How traders blow this up
- Chasing. Buying far above the level instead of near it — your stop becomes huge and your reward shrinks.
- No close confirmation. Jumping on an intraday poke that reverses by the close.
- Ignoring volume. Taking breakouts on weak participation — the hallmark of a fake-out.
- Stops too tight. Getting shaken out by normal noise just below the level.
- Oversizing. Risking too much per trade, so one bad streak ends you before the edge can play out.
- Fighting the market. Taking longs when the broader market is trending down.
- Moving the stop the wrong way. Widening a stop to avoid a loss — the opposite of "cut losses fast."