Overview
Bollinger Bands wrap price in a volatility envelope: a middle moving average with an upper and lower band set a number of standard deviations away. They show, at a glance, how stretched price is relative to its own recent volatility — and when that volatility is unusually quiet.
They're among the most popular indicators in the world, and also among the most misused — including in the one way their own creator explicitly warns against.
Origins & history
- 1980sJohn Bollinger developed the bands as a way to put adaptive, volatility-based envelopes around price.1
- 2010He later added two companion tools: %b (where price sits within the bands) and BandWidth (how wide they are — a direct volatility read).2
How it works
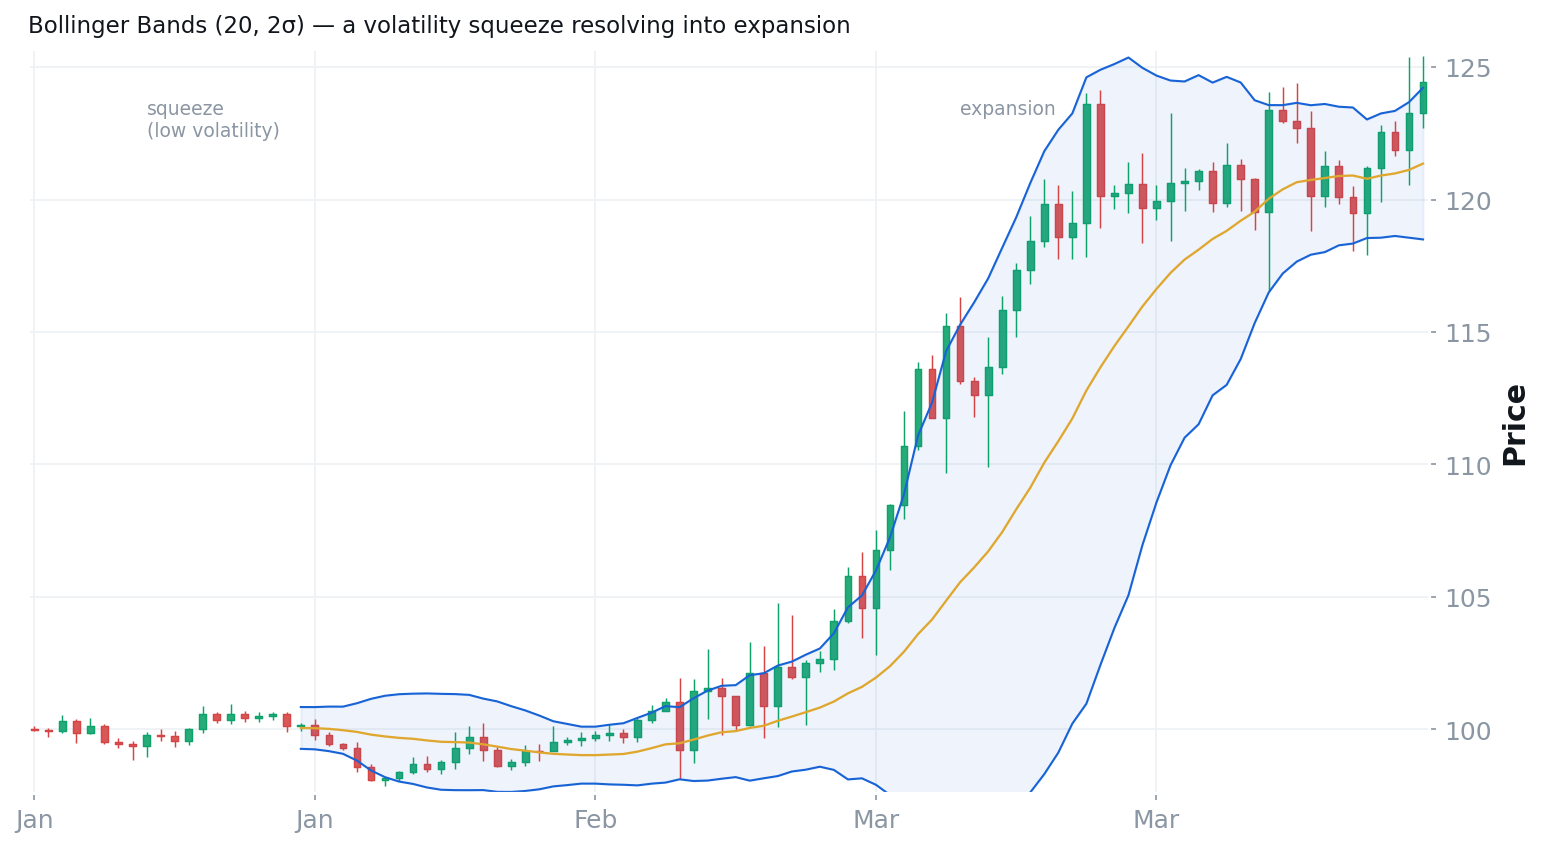
Two standard deviations contain roughly 95% of recent price action, so a touch of a band means price is statistically stretched for now. The bands breathe with volatility — wide when it's high, narrow when it's low. That narrowing is the famous squeeze: a period of unusually low volatility that often precedes a sharp expansion.1
Market psychology & mechanics
Bollinger Bands quantify what "normal" looks like right now. When price reaches the edge, the crowd has pushed it to a statistical extreme relative to recent behaviour — but a statistical extreme is not the same as an exhausted one. In a strong move, "stretched" can simply mean "strong," and price will keep going. The bands describe volatility; they do not, by themselves, call turns.
Honest assessment
Strengths
An objective, self-adjusting volatility framework: the squeeze flags coming expansion, %b and BandWidth turn "stretched" and "quiet" into numbers, and the bands adapt automatically to each market and regime.
The rule almost everyone breaks
This is the heart of it, in John Bollinger's own words: "Tags of the bands are tags, not signals." A touch of the upper band is not a sell signal, and a touch of the lower band is not a buy signal. In fact, he notes that closes outside the bands are initially continuation signals, and that in trending markets price routinely "walks" up the upper band or down the lower one.1 The most common retail use — fading the bands — is the exact thing the creator warns against.
Evidence rating: useful as volatility context (the squeeze especially); weak and often backwards as a standalone mean-reversion signal.
Weaknesses & failure modes
- NO DIRECTIONThey don't predict direction. A squeeze says a move is coming, not which way.
- TRENDSFading the bands fails in trends. Price walks the band; shorting every upper tag in an uptrend is a losing game.
- LAGThe middle band lags. It's a moving average, with all the lag that implies.
- ARBITRARY±2σ is a convention. The settings are sensible defaults, not magic numbers.
Professional uses vs. retail misuses
How professionals use them
- The squeeze to anticipate volatility expansion (direction confirmed elsewhere).
- As context — is price stretched or quiet? — alongside trend and a non-correlated tool.
- %b / BandWidth to quantify, not to trigger.
Common retail misuses
- Selling every upper-band tag, buying every lower-band tag.
- Fading bands in a trend (price just walks them).
- Treating a touch as a guaranteed reversal.
How a modern prop trader uses them
Bollinger Bands are the main indicator prop trader Lance Breitstein has used on his intraday and daily charts for 15+ years — and, in line with the creator's rule above, he never trades them as exact levels. He uses them three ways: (1) as a pendulum — a stock with no fresh news that stretches too far, too fast tends to snap back, the further the stretch the better the odds; (2) as a measure of overextension — but only once a stock is already trending and accelerating beyond the bands, not on a first breakout from a tight range; and (3) to sense volatility contraction — when the bands pinch and price sits mid-range ("no-man's-land"), he sizes down or stands aside. He pairs the pendulum read with his right side of the V — wait for the turn to confirm rather than catching the knife. He's blunt that crazy can get crazier, citing Keynes: a stretched market "can stay irrational longer than you can stay solvent."
WATCH Lance Breitstein — "The Bollinger Band Edge Most Traders Never Discover"
Going deeper
Companion tools: the Squeeze, %b, and BandWidth. Bollinger's advice is to confirm band signals with a non-correlated indicator (e.g., volume-based), not another price-derived one. Relatives: Keltner Channels (built on ATR rather than standard deviation) and the broader family of volatility envelopes. Bands pair naturally with volatility measures like ATR.
Practice
Quiz 1 — Price tags the upper Bollinger Band. Is that a sell signal?
No — and this is the key lesson. In John Bollinger's own words, "tags of the bands are tags, not signals." In a trend, price can walk up the upper band; a close outside is initially a continuation, not a reversal.
Quiz 2 — What is a Bollinger "squeeze," and what does it predict?
A period of unusually narrow bands (low volatility), which often precedes a sharp expansion. It predicts that a move is coming — but not which direction.
Quiz 3 — What do the bands actually measure?
Volatility — how far price is straying from its recent average, in standard deviations. They quantify "stretched" vs "quiet," not "overbought" vs "oversold."
This concept in the knowledge graph
Resources
- CONCEPTMoving averages (the middle band) & trend (why fading fails).
- GLOSSARYVolatility, moving average.
References (primary where possible)
- John Bollinger — the official Bollinger Band rules (incl. "tags are not signals") — bollingerbands.com.
- Bollinger Bands, %b and BandWidth — overview — StockCharts.