Overview
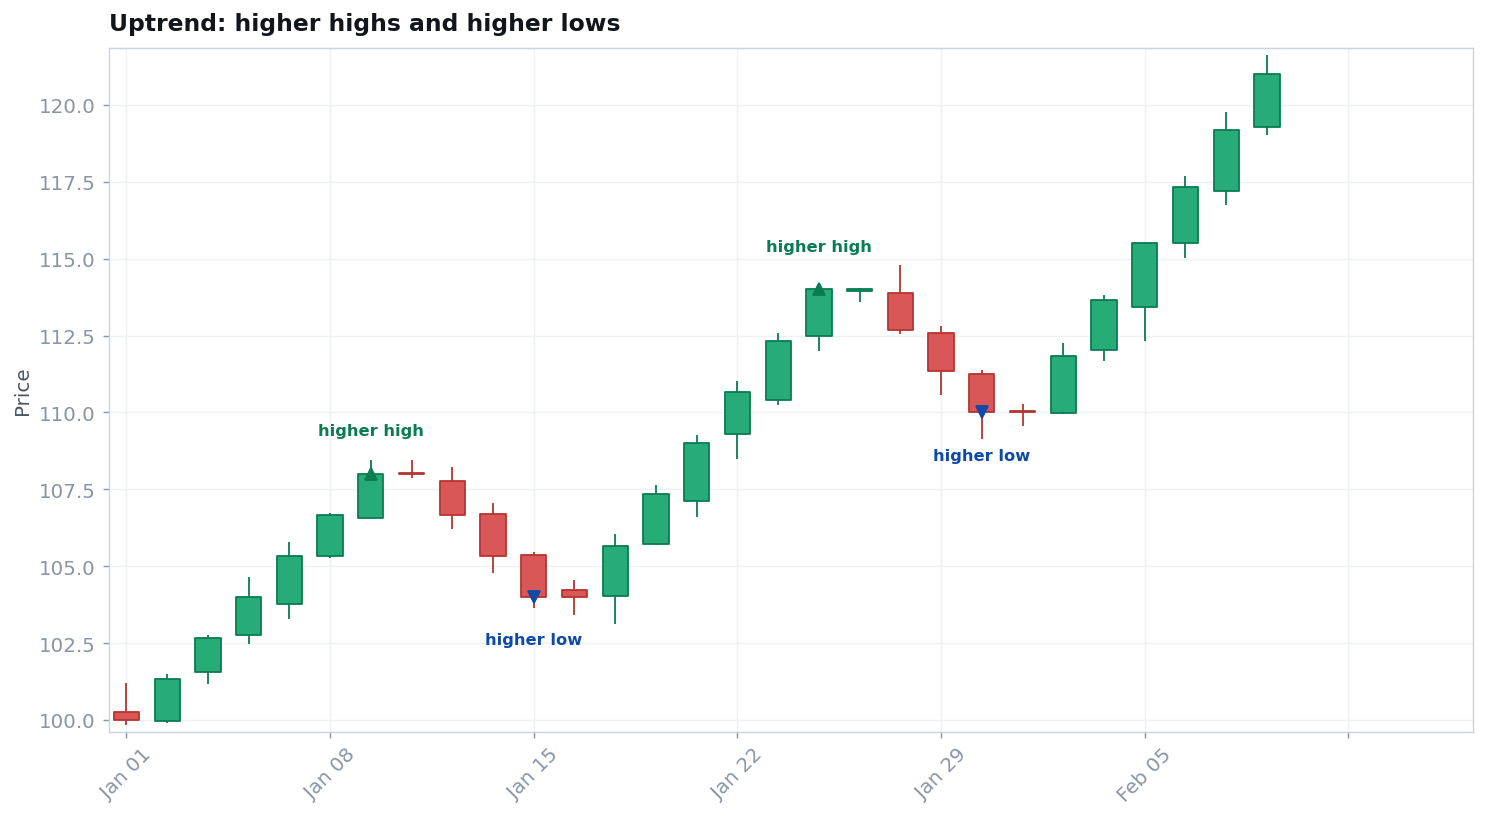
A trend is the prevailing direction of price: an uptrend makes higher highs and higher lows, a downtrend makes lower highs and lower lows, and a range does neither. Market structure is the framework of those swing points — the map that tells you which one you're in.
Almost every directional strategy is, at bottom, a bet about the trend continuing or changing. Reading structure is therefore the most fundamental skill in technical trading.
Origins & history
- 1900sThe framework traces to Charles Dow's editorials in The Wall Street Journal. He never wrote a book; his ideas were compiled into Dow Theory by S.A. Nelson, William Hamilton, and Robert Rhea.1
- TenetsDow Theory's six tenets still underpin trend analysis: the market discounts everything; trends have three scales (primary, secondary, minor) and three phases (accumulation, participation, distribution); volume confirms; indices must confirm each other; and a trend persists until a clear reversal.1
How it works
The reading is mechanical once you see it:
- ·Uptrend. A sequence of higher highs (HH) and higher lows (HL).
- ·Downtrend. Lower highs (LH) and lower lows (LL).
- ·Break of structure. An uptrend making a lower low (or a downtrend a higher high) is the first warning the trend may be changing.
- ·Range. Overlapping swings between support and resistance — no trend; most price action lives here.
Market psychology & mechanics
Trends exist because information and conviction spread slowly. New information re-rates value, but participants react in waves — early movers, then the crowd, then the latecomers — so price travels in a direction over time rather than gapping instantly to a new equilibrium. The swing highs and lows are simply the footprints of those supply-and-demand battles: each higher low marks a place buyers stepped in earlier and more eagerly than before.
Honest assessment
Strengths
Structure gives an objective, universal definition of direction and a clear invalidation point (the level whose break ends the trend). It aligns with the single most robust market edge — momentum — and works on every market and timeframe.
The evidence — both sides
Against trends: the Random Walk Hypothesis (Bachelier, Fama, popularized by Burton Malkiel's A Random Walk Down Wall Street) holds that short-term price changes are essentially unpredictable — that much of what looks like "trend" is noise we pattern-match after the fact.2 For trends: the momentum literature (Jegadeesh & Titman, 1993) provides robust evidence that intermediate-term trends — over 3–12 months — genuinely persist and are tradeable.3
Evidence rating: short-term price action is close to random; intermediate-term trends are real and well-documented. Trade the timeframe where the edge actually lives.
Weaknesses & failure modes
- HINDSIGHTTrends are obvious only in the rear-view mirror. In real time, a pullback and a reversal look identical at first.
- TIMEFRAME"The trend" depends on timeframe. A stock can be in an uptrend on the daily and a downtrend on the hourly at the same time.
- CHOPMost action is range. Markets trend a minority of the time; forcing trend tools onto ranges produces whipsaws.
Professional uses vs. retail misuses
How professionals use it
- Define the trend on a higher timeframe, then trade with it on a lower one.
- Use the break of structure as a clear invalidation / exit.
- Accept ranges and stand aside, rather than forcing trades.
Common retail misuses
- Calling a trend after one or two bars.
- Fighting the higher-timeframe trend on a lower-timeframe hunch.
- Treating every wiggle as a new trend.
Going deeper
Related ideas: the three trend scales and three phases of Dow Theory, "break of structure" and "change of character," Wyckoff's accumulation/distribution phases, and trend strength tools like ADX and moving-average slope. Multi-timeframe: the strongest setups occur when the higher and trading timeframes agree — a higher-timeframe uptrend with a lower-timeframe pullback into a higher low.
Practice
Quiz 1 — What defines an uptrend in market-structure terms?
A sequence of higher highs and higher lows. As long as each pullback bottoms above the last and each push exceeds the last high, the uptrend is intact.
Quiz 2 — What is a “break of structure,” and why does it matter?
When an uptrend makes a lower low (or a downtrend a higher high), structure has broken — the first objective warning the trend may be changing, and a common invalidation point.
Quiz 3 — Is a trend on the 5-minute chart the same as the trend on the daily?
No. Trend is timeframe-dependent — a market can be up on one timeframe and down on another. Professionals define direction on a higher timeframe and time entries on a lower one.
This concept in the knowledge graph
Resources
- TRADERCharles Dow — the origin of trend analysis.
- PLAYBOOKDow Theory Confirmation.
- GLOSSARYTrend, bull market, bear market.
References (primary where possible)
- Dow Theory — Charles Dow's editorials, the six tenets, and the work of Nelson, Hamilton & Rhea — Wikipedia.
- The Random Walk Hypothesis — Burton Malkiel, A Random Walk Down Wall Street; overview — Wikipedia.
- Jegadeesh & Titman, "Returns to Buying Winners and Selling Losers," Journal of Finance, 1993 — Wiley.