1 The Edge — why it works
Strong stocks rise in stair-step boxes
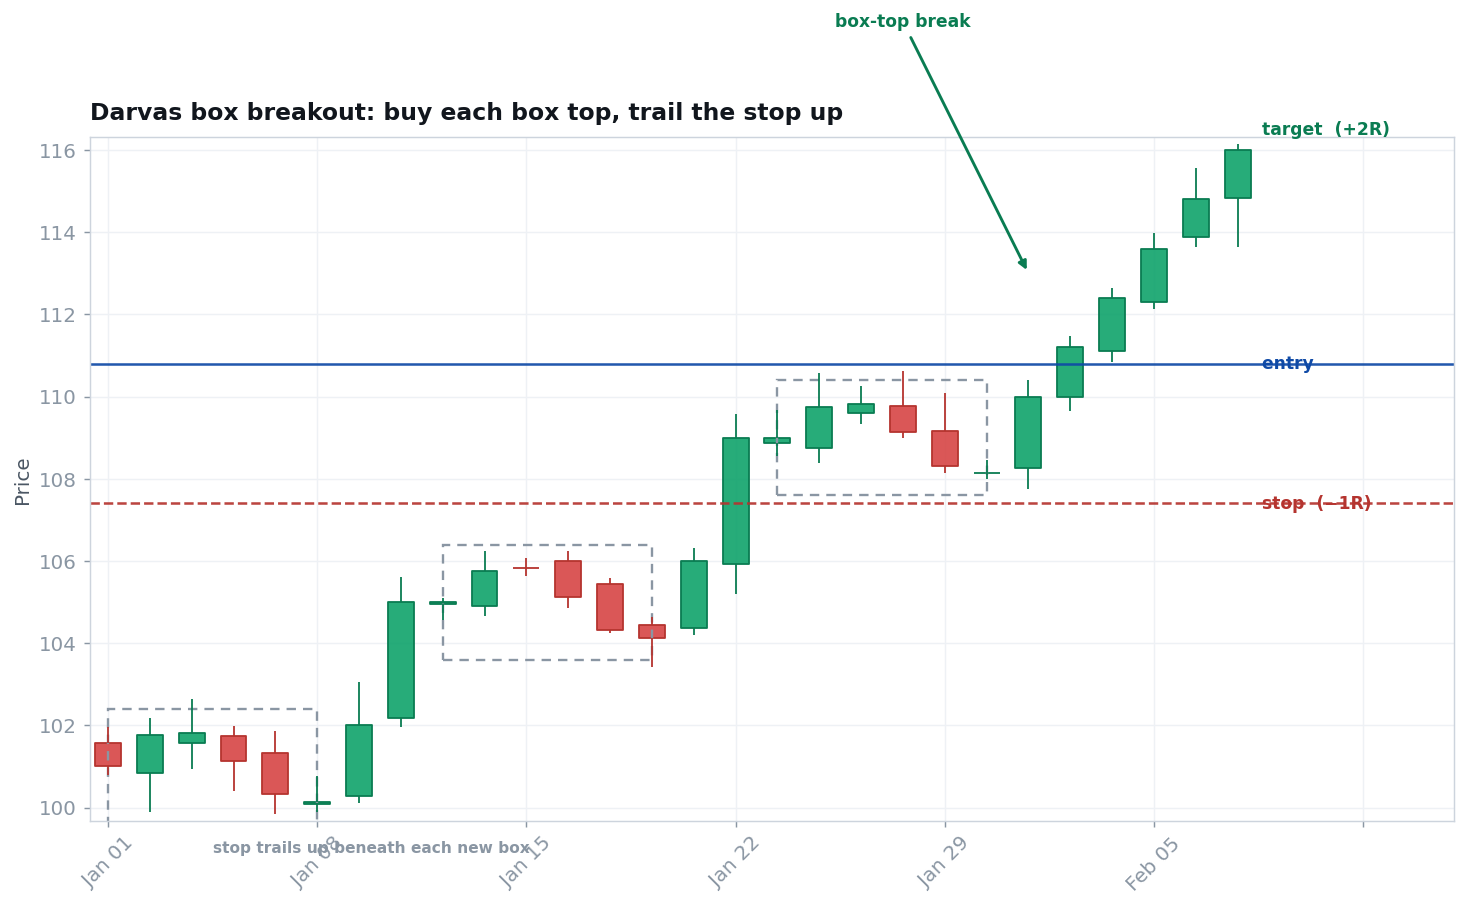
Darvas noticed leading stocks don't climb smoothly — they jump, consolidate in a tight range (a 'box'), then jump again. Buy the breakout above the box top to a new high on volume, set a stop just below the box, and ride the stair-step up, raising the stop beneath each new box.
It's a close cousin of the pivotal-point breakout — but with an explicit, mechanical box and trailing-stop framework that keeps you in strong leaders while capping risk.
2 Where it works — and doesn't
Conditions matter more than the pattern
Works best when…
- Leading stocks with strong earnings, making new highs.
- A tight, well-defined box (a clear recent high and low after a pause).
- A breakout above the box top on a surge of volume.
- A strong overall market lifting leaders.
Fails / avoid when…
- Weak, laggard, or beaten-down stocks.
- Loose, wide boxes (the stop becomes huge).
- A breakout on weak volume.
- A choppy or falling market.
3 Setup checklist
All true before you act
- ✓A strong stock near highs. A leader with momentum, not a cheap turnaround bet.
- ✓A defined box. A clear recent high (top) and low (bottom) after price paused.
- ✓A volume breakout. Price clears the box top to a new high on expanded volume.
- ✓A stop below the box. There's a sane place just under the box to be proven wrong.
4 The process
From signal to managed trade
Entry
Buy the breakout above the box top on volume — a genuine new high.
Stop (1R)
Just below the box bottom. Entry − stop = 1R.
Position size
Risk a small fixed % of the account; shares = risk ÷ 1R.
Exit & manage
As price forms higher boxes, raise the stop beneath each new box — locking in gains while letting the leader run. Exit when a box breaks down.
5 Worked example (illustrative)
One trade, start to finish, in R
| Account / risk per trade | $25,000 · 1% = $250 |
| Entry (breakout above box top) | $50.50 |
| Stop (below the box) — 1R | $47.50 · 1R = $3.00/share |
| Position size = $250 ÷ $3.00 | ≈ 83 shares |
| Trailed up boxes to +3R | $59.50 |
| If it works: +3R | + $747 (≈ +3.0%) |
| If it fails: −1R | − $249 (≈ −1.0%) |
6 Honest expectancy
Momentum math: a few big winners
Like other breakout methods, the Darvas box wins less than half the time — but trailing the stop up boxes lets the winning leaders run far beyond the small, capped losses.
Example: win 40% at +4R, lose 60% at −1R → (0.40 × 4) − (0.60 × 1) = +1.0R per trade. It depends on a market that's producing strong leaders. An expectation, never a guarantee.
7 Make it yours
Test before you trade
A no-risk validation routine
Find past leading stocks in strong markets and mark their boxes — the tight ranges between jumps. For each box breakout, record the entry, the below-box stop, and how a box-trailing stop would have managed the trade, in R. You'll see how the method keeps you in leaders and out of laggards.
8 Common mistakes
How traders blow this up
- Chasing. Buying far above the box top makes the stop huge and the reward small.
- Loose boxes. A wide box means a wide stop — wait for a tight one.
- Ignoring volume. A box breakout without volume is a likely fake-out.
- Weak stocks. The method is for leaders making new highs, not cheap laggards.
- Not trailing. The trailing stop under each box is what protects the gains.