Overview
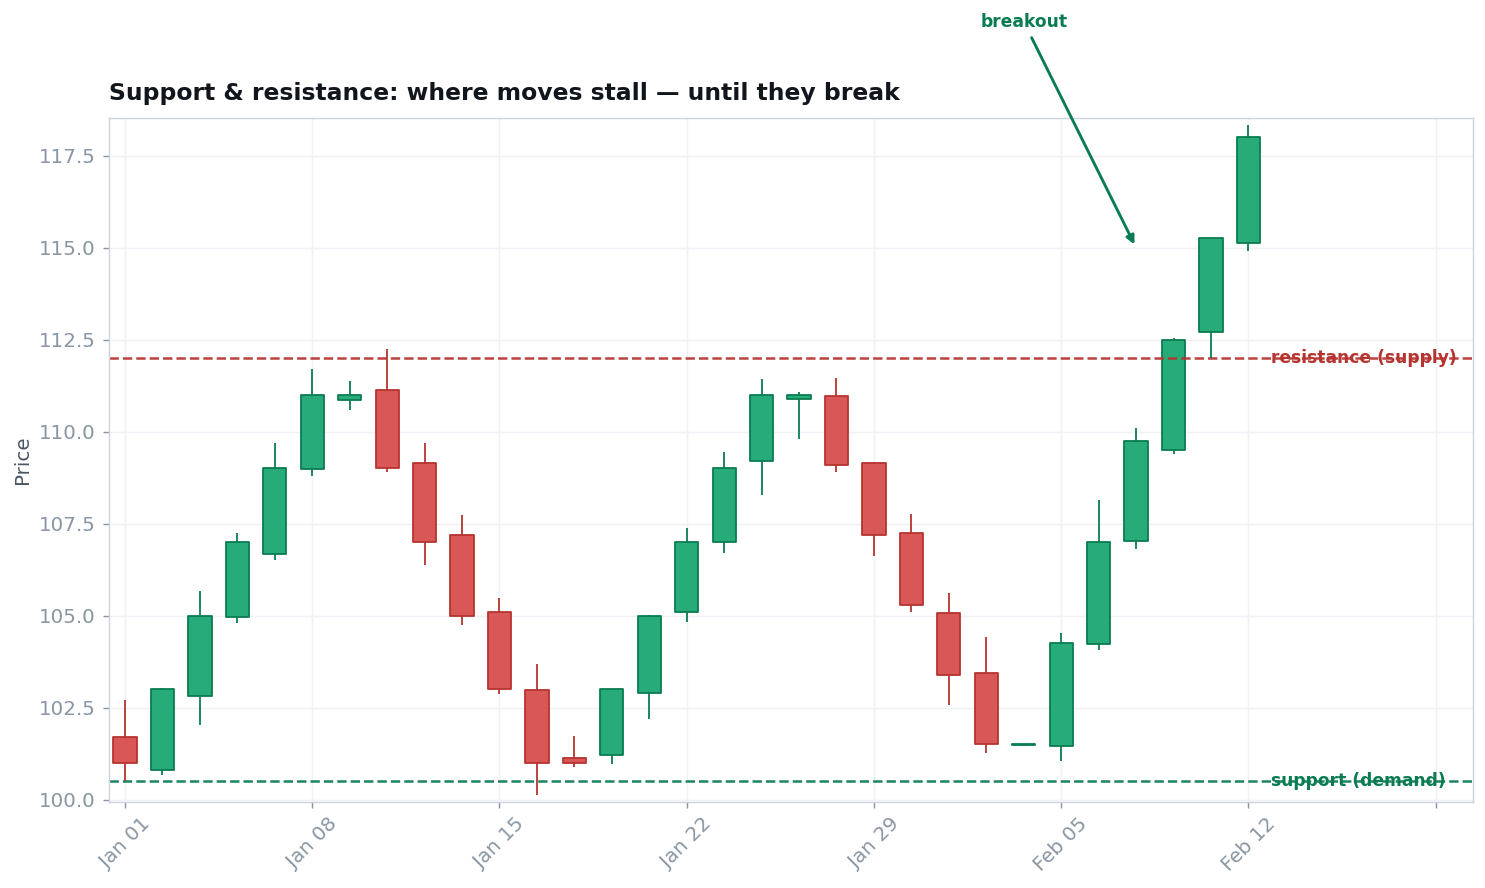
Support and resistance are price areas where the balance of supply and demand has repeatedly turned the market: support is where falling prices tend to stall as buyers step in, resistance is where rising prices stall as sellers do. They are the reference points around which most trading decisions are framed.
Think of them as zones, not exact lines — areas where reactions have happened before and may happen again.
Origins & history
- 1900sSupport/resistance is foundational to technical analysis, rooted in the supply-and-demand reading of Charles Dow and Richard Wyckoff.
- 1948Robert Edwards & John Magee codified it for generations in Technical Analysis of Stock Trends, including the role-reversal principle — broken resistance becomes support, and vice versa.2
How it works
Levels come from a few recurring places:
- ·Prior swing highs and lows. The most common and reliable — places price has clearly reversed before.
- ·Prior consolidation / value areas. Zones where lots of volume traded and many positions were opened.
- ·Round numbers. Psychological levels ($100, 5000 on an index) attract orders.
- ·Role reversal & confluence. A broken level flips role; a level that lines up with a moving average or VWAP is stronger.
Market psychology & mechanics
Two forces make levels real. First, order clustering: resting limit orders and protective stops pile up at obvious prices, so price genuinely meets more supply or demand there. Second, memory and regret: buyers who missed a bounce wait to buy the retest; sellers trapped from a prior high wait to exit at breakeven; everyone anchors to round numbers. Because so many participants watch the same levels, reactions become partly self-fulfilling — which is also exactly why larger players hunt the stops clustered just beyond them.
Honest assessment
Strengths
Support/resistance gives objective reference points: where to expect a reaction, where to place a stop, and where a break changes the story. Role reversal and confluence make the best levels genuinely high-probability.
The evidence — both sides
For: Carol Osler's 2000 Federal Reserve study tested the published support/resistance levels of six FX firms (1996–1998) and found they had real predictive power for intraday trend reversals — with the effect lasting up to five business days.1
Against: Adam Grimes demonstrates that much retail-drawn support/resistance is no more meaningful than lines drawn at random — you need a specific reason to expect non-random action at a level, not just a line on a chart.3
Evidence rating: well-chosen, high-confluence levels carry a measurable edge; arbitrary lines do not. The skill is telling the two apart.
Weaknesses & failure modes
- SUBJECTIVEIt's drawable many ways. Ten traders draw ten slightly different levels; precision is an illusion.
- SWEEPSStops get hunted. Obvious levels are where liquidity sits, so failed breakouts and stop-runs are common (the turtle soup / Wyckoff spring).
- BREAKLevels break. Every level eventually fails; treating one as a wall invites large losses.
- CONTEXTNot a signal alone. A level is a place to watch, not an automatic trade.
Professional uses vs. retail misuses
How professionals use it
- To define risk — stops just beyond a level, sized to that distance.
- Trading the reaction (reclaim/reject) or the confirmed break, not the line blindly.
- Demanding confluence and a reason for non-random behaviour.
Common retail misuses
- Drawing dozens of arbitrary lines and forcing trades at them.
- Assuming a level is a guaranteed bounce or hard wall.
- Buying right into resistance / shorting into support with no edge.
Going deeper
Related ideas: supply/demand zones, role reversal, round-number levels, liquidity sweeps and failed breakouts, and confluence with VWAP, moving averages, volume-by-price, and Fibonacci. Multi-timeframe: higher-timeframe levels dominate — a weekly level outranks a 5-minute one, and the strongest levels are those visible across several timeframes at once.
Practice
Quiz 1 — What is “role reversal”?
When a level finally breaks, it tends to flip function: broken resistance becomes support, and broken support becomes resistance — because the participants trapped there now act in the opposite direction.
Quiz 2 — Why are obvious levels often where stops get hunted?
Because resting stops and orders cluster at obvious levels — that liquidity is exactly what larger players want to fill against, producing failed breakouts and quick reversals (a stop-run).
Quiz 3 — Is every horizontal line a meaningful level?
No. Grimes shows that much drawn S/R is no better than random. A level matters only with a reason for non-random action — confluence, a clear prior reaction, real order flow — not just because you drew it.
This concept in the knowledge graph
Resources
- TRADERWyckoff (supply/demand) & Grimes (the randomness caveat).
- PLAYBOOKWyckoff Spring & Turtle Soup.
- GLOSSARYSupport, resistance, breakout.
References (primary where possible)
- Carol L. Osler, "Support for Resistance: Technical Analysis and Intraday Exchange Rates," FRBNY Economic Policy Review, July 2000 — newyorkfed.org.
- Robert D. Edwards & John Magee, Technical Analysis of Stock Trends (1948) — the classic codification of support/resistance and role reversal.
- Adam Grimes — support/resistance and randomness — adamhgrimes.com; see our Technicals page.