1 The Edge — why it works
In a strong trend, the first dip to the average is a gift
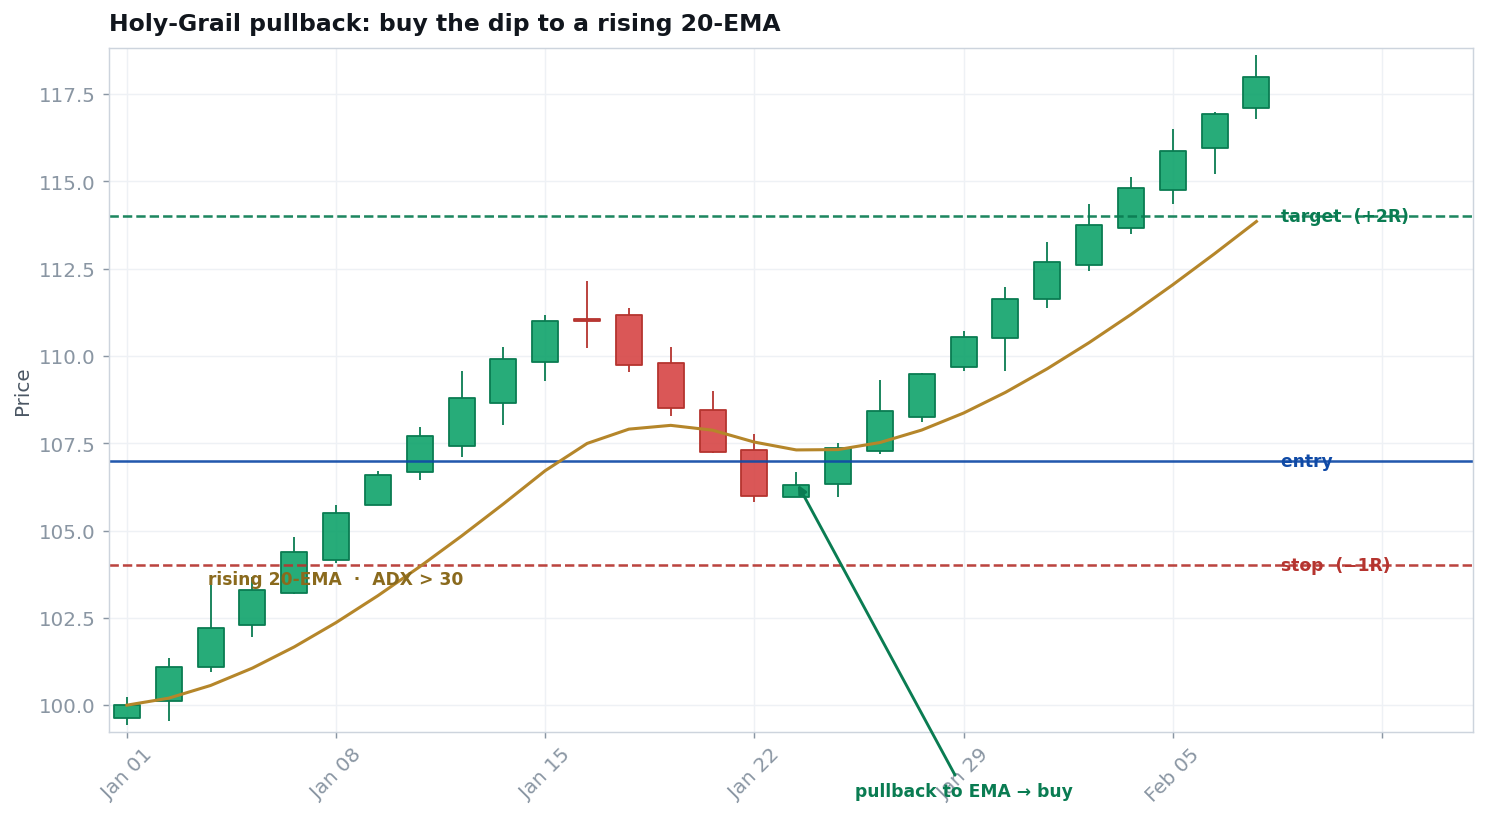
Raschke's 'Holy Grail' pairs a trend filter with a precise entry. First, ADX above ~30 confirms the trend has real strength. Then you wait for the inevitable pullback — the first dip back to a rising 20-period moving average — and buy as price turns up off it. You are not predicting a reversal; you are buying a temporary discount inside a trend that has already proven itself.
The combination is what matters. ADX makes sure the trend is worth trading; the 20-EMA gives a repeatable, objective place to buy the dip with a tight, logical stop just beneath it.
2 Where it works — and doesn't
Conditions matter more than the pattern
Works best when…
- A strongly trending market (ADX above ~30).
- An orderly first pullback to a rising 20-EMA.
- A clear turn back up off the average to trigger entry.
- Liquid markets where the average is respected.
Fails / avoid when…
- A flat or weak trend (low ADX) — the average gets sliced.
- A deep, violent pullback that breaks the trend structure.
- A late-stage, over-extended trend rolling over.
- Buying the dip with no turn-up confirmation.
3 Setup checklist
All true before you act
- ✓ADX confirms strength. ADX is above ~30 — the trend is strong enough to buy into.
- ✓A rising 20-EMA. The 20-period average is clearly sloping with the trend.
- ✓A first pullback to it. Price dips back and tests the rising average, ideally the first such test.
- ✓A turn-up trigger. Price stops falling and turns back up off the average — your signal to enter.
4 The process
From signal to managed trade
Entry
Buy as price turns up off the 20-EMA — e.g., a buy-stop above the prior bar's high during the pullback.
Stop (1R)
Below the pullback low / just under the 20-EMA. Entry − stop = 1R.
Position size
Risk a small fixed % of the account; shares = risk ÷ 1R.
Exit & manage
Target the prior swing high or a fixed multiple (+2R); trail if the trend extends. Stand aside once ADX fades.
5 Worked example (illustrative)
One trade, start to finish, in R
| Account / risk per trade | $25,000 · 1% = $250 |
| ADX | 34 — strong trend |
| Entry (turn-up off 20-EMA) | $80.00 |
| Stop (below pullback low) — 1R | $77.50 · 1R = $2.50/share |
| Position size = $250 ÷ $2.50 | = 100 shares |
| Target (prior high, ≈ +2R) | $85.00 |
| If it works: +2R | + $500 (≈ +2.0%) |
| If it fails: −1R | − $250 (≈ −1.0%) |
6 Honest expectancy
High-odds entries in proven trends
Because you only buy dips in trends that ADX has already confirmed, the win rate is respectable and the stop is tight beneath the average. The winners are first-leg resumptions, not whole trends, so targets are modest but reliable.
Example: win 55% at +2R, lose 45% at −1R → (0.55 × 2) − (0.45 × 1) = +0.65R per trade. Drop the ADX filter and the average gets chopped to pieces in ranges. An expectation, never a guarantee.
7 Make it yours
Test before you trade
A no-risk validation routine
Add ADX and a 20-period EMA to charts. Scroll history and mark every spot where ADX was above ~30 and price pulled back to a rising 20-EMA, then turned up. Record the entry, the below-pullback stop, and the result in R — before revealing the outcome. Compare trades taken with ADX above 30 to those below it; the filter's value will be obvious.
8 Common mistakes
How traders blow this up
- Skipping the ADX filter. Buying 20-EMA dips in a weak/flat market gets you chopped up.
- No turn-up. Wait for price to actually turn off the average, not just touch it.
- Chasing extension. Late in a trend, the first clean pullback is long gone — odds drop.
- Stops too tight. Place the stop below the pullback low, not at the average itself.
- Overstaying the target. It is a resumption trade — bank the move, then look for the next dip.