1 The Edge — why it works
A failed breakout traps the breakout buyers
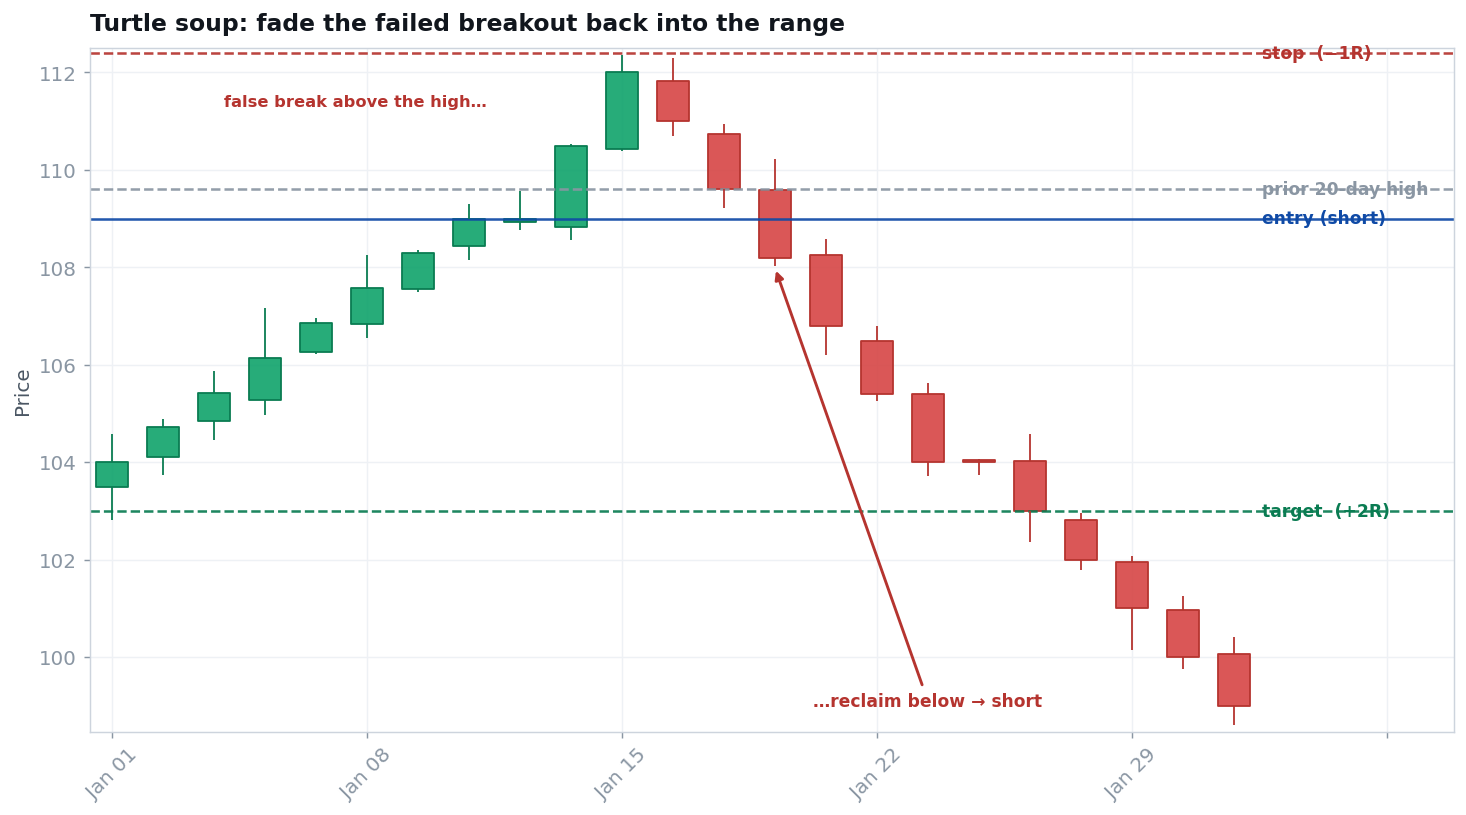
When price pushes to a new high (or low) and immediately fails back inside the range, everyone who bought the breakout is now offside. Their stops, triggering below the level, become fuel for a reversal. You fade the failed breakout for a quick mean-reversion move back through the range.
This is the mirror image of a trend-following breakout — and it thrives in exactly the conditions where breakouts don't work: range-bound, choppy markets.
2 Where it works — and doesn't
Conditions matter more than the pattern
Works best when…
- Range-bound or choppy markets (not strong trends).
- A clean prior swing high/low (e.g. a 20-day extreme).
- The new extreme is marginal and quickly reversed.
- Price closes back inside the range promptly.
Fails / avoid when…
- Strong trending markets — real breakouts run and bury you.
- No clear prior level to fail against.
- The 'failure' that keeps going (it wasn't a failure).
- Forcing it when price grinds, not snaps, back.
3 Setup checklist
All true before you act
- ✓A prior N-day extreme. A clear recent high or low (e.g. 20-day) for price to marginally exceed.
- ✓A marginal new extreme. Price pokes just beyond the level — not a powerful, high-volume thrust.
- ✓A prompt reversal. Price closes back inside the range quickly, trapping the breakout crowd.
- ✓Not fighting a trend. The broader context is range/chop, not a strong directional move.
4 The process
From signal to managed trade
Entry
When price reverses back inside the range after the false break — e.g., short on the reclaim below the prior high.
Stop (1R)
Just beyond the false-breakout extreme (above the spike high for a short). Distance = 1R.
Position size
Risk a small fixed % of the account; shares = risk ÷ 1R.
Exit & manage
This is a short-term trade — target the middle or far side of the range, or a fixed multiple (e.g. +2–3R). Take the profit; don't marry it.
5 Worked example (illustrative)
One trade, start to finish, in R
| Account / risk per trade | $25,000 · 1% = $250 |
| Prior 20-day high | $100.00 |
| Entry (reclaim below the high, short) | $99.50 |
| Stop (above the spike) — 1R | $101.20 · 1R = $1.70 |
| Position size = $250 ÷ $1.70 | ≈ 147 shares |
| Target (mid-range, ≈ +3R) | $94.40 |
| If it works: +3R | + $750 (≈ +3.0%) |
| If it fails: −1R | − $250 (≈ −1.0%) |
6 Honest expectancy
Higher win rate, smaller winners
Mean-reversion setups like this tend to win more often than they lose, but the winners are smaller — you're catching a snap-back, not a trend. The math still works if the wins outweigh the losses.
Example: win 55% at +2R, lose 45% at −1R → (0.55 × 2) − (0.45 × 1) = +0.65R per trade. Get the market regime wrong (a real trend) and the edge inverts. An expectation, never a guarantee.
7 Make it yours
Test before you trade
A no-risk validation routine
Scroll a range-bound market's history. Mark every spot price marginally broke a 20-day extreme and snapped back inside. Record the entry, the stop beyond the extreme, and a mid-range target — in R — before revealing the outcome. Compare results in ranging vs. trending periods; you'll see why regime matters.
8 Common mistakes
How traders blow this up
- Fading a real breakout. In a strong trend, the breakout runs — this setup is for ranges.
- No prompt reversal. If it doesn't snap back fast, it wasn't a failure.
- Stop inside the spike. Place it beyond the false-break extreme, not in the noise.
- Overstaying. It's a quick mean-reversion trade — take the target, don't hope for a trend.
- Ignoring regime. Know whether the market is trending or ranging before you fade anything.
Watch — a mean-reversion edge, backtested
A reputable, free explainer from this playlist — educational, not an endorsement.
