Overview
MACD — Moving Average Convergence/Divergence — is the most popular trend-and-momentum indicator in technical analysis. It tracks the relationship between two moving averages of price: when they pull apart, momentum is building; when they converge, it's fading.
Unlike RSI, MACD is unbounded — it oscillates around a zero line rather than between 0 and 100 — so it reads momentum and trend together, but its values can't be compared across different stocks.
Origins & history
- 1970sMACD was created by Gerald Appel, a New York technical analyst and money manager, in the late 1970s.1
- 1986Thomas Aspray added the histogram — the bar chart of the gap between the MACD and its signal line — to give an earlier read on momentum shifts.1
How it works
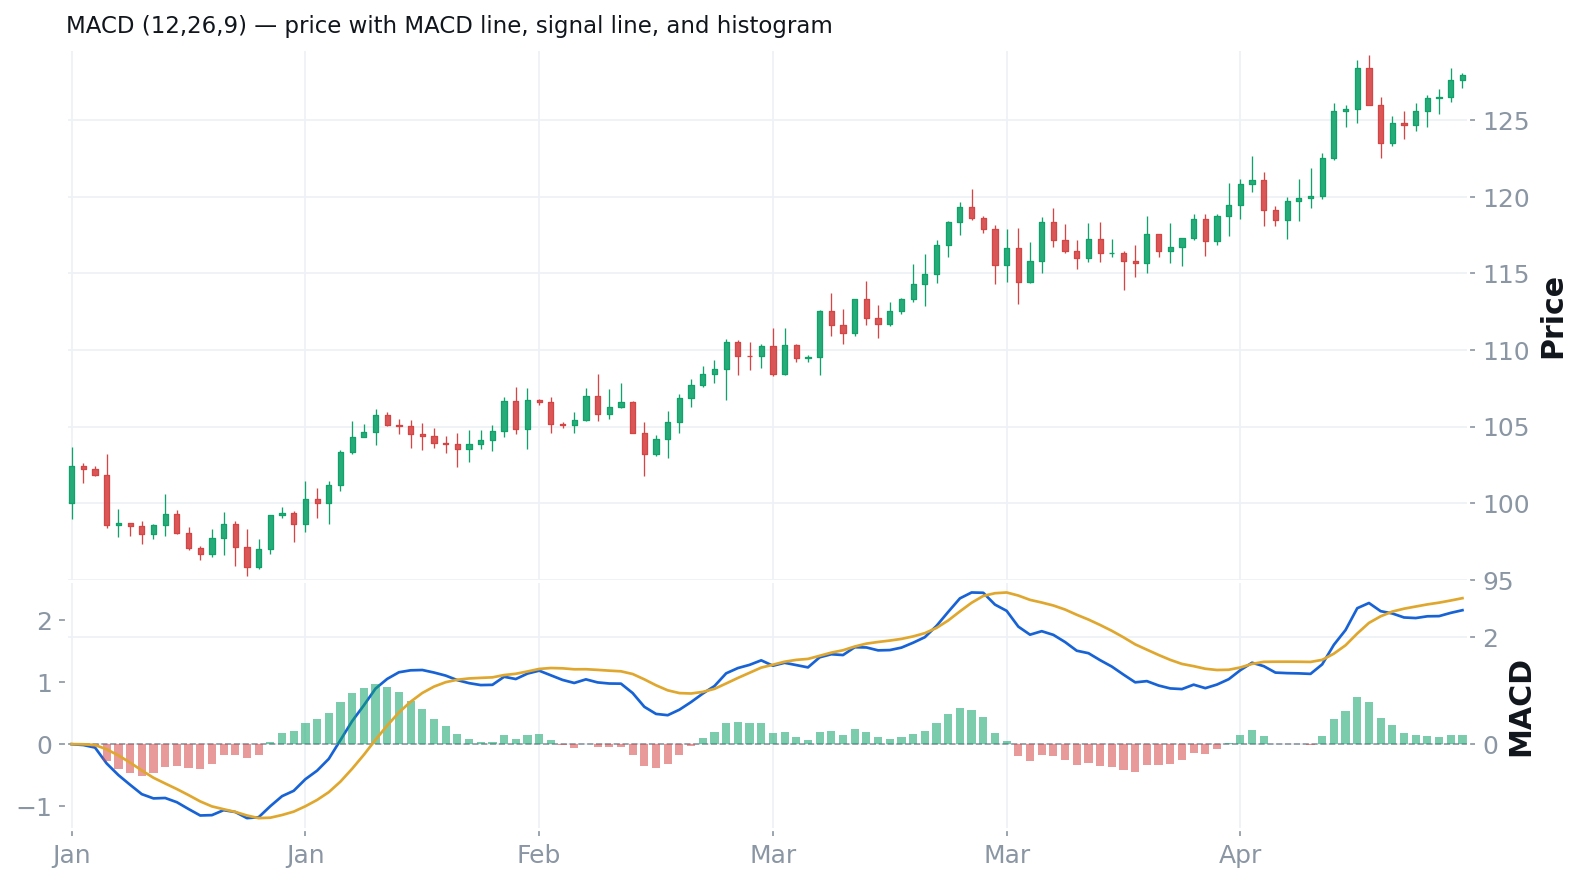
MACD is three series in one:
The default settings are 12, 26, 9. Traders read three things: the signal-line crossover (MACD crossing its signal), the zero-line crossover (the faster EMA crossing the slower — a trend change), and the histogram, which grows as momentum accelerates and shrinks before a crossover, giving an earlier heads-up.1
Market psychology & mechanics
MACD is, at heart, a question about acceleration: is the recent average price pulling away from the longer average (momentum building) or falling back toward it (momentum fading)? That "convergence and divergence" of the two averages is a compact picture of whether the crowd's enthusiasm is strengthening or running out of steam — which is why the histogram often turns before price does.
Honest assessment
Strengths
It combines trend and momentum in one view, the histogram offers an early read on momentum shifts, and divergence between MACD and price is a classic (if imperfect) warning that a move is tiring. It is simple, universal, and visual.
The evidence
Honest framing: MACD is a derivative of moving averages, so it inherits their properties — useful in trends, poor in ranges — plus extra lag. As with simple MA rules, there is some historical support for trend-confirmation use and little robust evidence that naive MACD crossovers are a standalone edge, especially after costs.
Evidence rating: useful as trend/momentum context and for divergence warnings; weak as a mechanical crossover system on its own.
Weaknesses & failure modes
- DOUBLE LAGIt lags twice over. Built from EMAs, with a signal line that is an EMA of the MACD — an average of an average. It confirms late.
- WHIPSAWIt fails in ranges. Sideways markets produce a stream of false crossovers around the zero line.
- UNBOUNDEDNo fixed levels. There is no universal "overbought" MACD value; readings aren't comparable across stocks (use the PPO for that).
- DIVERGENCEDivergence can persist. MACD can diverge from price for a long time in a strong trend.
Professional uses vs. retail misuses
How professionals use it
- As a confirmation of trend and momentum, with structure — not a sole trigger.
- The histogram for an early read on fading momentum.
- Divergence as a warning to tighten risk, not to reverse blindly.
Common retail misuses
- Trading every crossover mechanically in chop.
- Treating divergence as an automatic reversal signal.
- Comparing raw MACD values between different stocks.
How a modern prop trader uses it
Prop trader Lance Breitstein admits he often doesn't use MACD at all — being lagging, it confirms after much of the move is gone, so he leans on price and structure instead. Where he does see value lines up with the assessment above: as a momentum gauge (above zero with growing bars = stay in a good trend longer instead of bailing on the first pullback) and as a divergence clue (a new price high on a lower MACD high = the move is tiring) — a reason to tighten risk, never a standalone trigger. He's emphatic that in choppy, range-bound markets MACD should be ignored, because it whipsaws endlessly.
WATCH Lance Breitstein — "What Traders Get Wrong About MACD"
Going deeper
Variations: different settings for faster/slower response; the PPO (Percentage Price Oscillator), which expresses MACD as a percentage so it can be compared across stocks; and MACD-Histogram strategies. Multi-timeframe: use a higher-timeframe MACD for the trend/regime and a lower-timeframe MACD to time entries in that direction.
Practice
Quiz 1 — What does the MACD histogram actually show?
The gap between the MACD line and its signal line. A growing histogram means momentum is accelerating; a shrinking one means it's fading — often before the lines actually cross, which is why it's an earlier signal.
Quiz 2 — Why does MACD lag more than a single moving average?
It's an average of averages: built from EMAs, with a signal line that is itself an EMA of the MACD. More smoothing means more confirmation but later signals.
Quiz 3 — How is MACD different from RSI?
RSI is a bounded (0–100) oscillator with fixed overbought/oversold levels. MACD is unbounded, built from two EMAs, reading trend and momentum together — its values aren't comparable across stocks.
This concept in the knowledge graph
Resources
- CONCEPTMoving averages (its building block) & Oscillators.
- GLOSSARYMACD, divergence.
References (primary where possible)
- MACD — Gerald Appel (late 1970s), the 12/26/9 formula, components, and Thomas Aspray's histogram (1986) — Wikipedia.