Where a moving average follows price, an oscillator measures its momentum — how fast and how stretched a move is. Most swing between bounds, so they flag when a market is \‘overbought\’ or \‘oversold,\’ and, most usefully, when momentum quietly disagrees with price.
RSI
The Relative Strength Index runs 0–100. Above ~70 is often called overbought, below ~30 oversold — but in a strong trend it can pin at an extreme for a long time.
MACD
Built from two moving averages plus their difference (a histogram). It reads the trend\’s strength and turns — a blend of trend and momentum in one tool.
Divergence
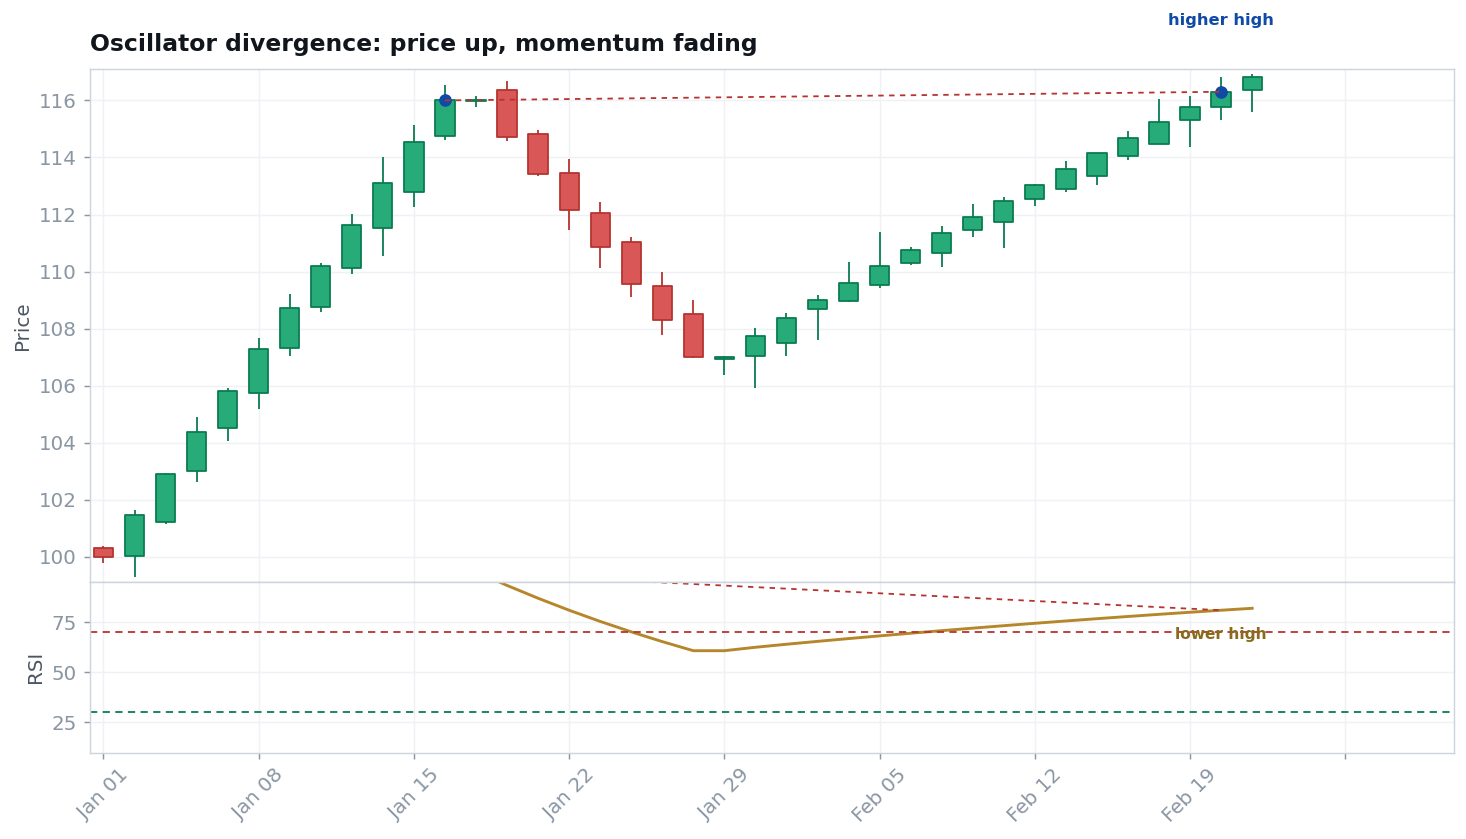
The highest-value signal: price makes a higher high while the oscillator makes a lower high (or vice-versa). Momentum is fading even as price pushes on.
Not a standalone
Oscillators lie in strong trends. Use them with structure and trend — as confirmation, not as a buy/sell button.
The family tree, and what each member is for
Nearly every oscillator on a modern platform descends from a handful of inventors, and knowing the lineage tells you what each tool was designed to answer. J. Welles Wilder's RSI (1978) measures the internal balance of up-days versus down-days — "how one-sided has this move been?" George Lane's Stochastic (1950s) asks a different question: "where is the close inside the recent range?" — closes pinned near the highs mean buyers finish the day in control. Gerald Appel's MACD (1970s) isn't a bounded oscillator at all but the gap between two moving averages, so it reads trend and momentum together. Later variants — Williams %R, CCI, Connors RSI — are refinements of the same two questions. The practical consequence: stacking three oscillators on one chart usually means asking the same question three times and calling the echoes "confirmation."
Overbought is a context call, not a signal
The classic 70/30 thresholds assume a market that oscillates. In a genuine trend, the assumption fails in the most expensive way possible: a strong uptrend can hold RSI above 70 for weeks while doubling — every "overbought" reading a fresh invitation to fight it. This is why the trend-following tradition largely ignores oscillators and the mean-reversion tradition builds its entire method on them: the reading only means something after you've decided what regime you're in (see market structure). Larry Connors' RSI-2 work even inverts the folklore — using deeply "oversold" short-period readings as buy signals, but only inside confirmed uptrends (the playbook).
Divergence, honestly
Divergence is the oscillator's best trick and its most oversold one. The logic is sound — price pushing to new highs on fading momentum often precedes a turn — but divergences resolve both ways: strong trends routinely print divergence after divergence while marching on. Treat a divergence as a warning to tighten risk, never as a standalone reversal signal; demand structure confirmation (a broken swing low, a failed retest) before acting on it. Wilder himself framed his tools as components of complete systems with defined exits — the single-indicator buy/sell button was never the design.
See also
- DEEP DIVEMACD — the definitive guide.
- DEEP DIVERSI — the definitive guide.
- CONCEPTMoving Averages — MACD is built from them; Volume — another conviction read.
- TRADERAlexander Elder — the Triple Screen; Linda Raschke — momentum & oscillators.
- COURSEMasterclass: the indicators modules
Sources (free / verified)
1. RSI, ATR, ADX and their construction: J. Welles Wilder, New Concepts in Technical Trading Systems (Trend Research, 1978) — Wilder profile. 2. Stochastics: George Lane profile; MACD: Gerald Appel profile. 3. Reference charts: StockCharts ChartSchool.