Overview
Volume is the number of shares or contracts traded in a period. If price tells you what happened, volume tells you how much conviction was behind it — the participation, the effort, the urgency.
It is the second dimension of every chart, and the raw material from which order flow, VWAP, and most professional context is built.
Origins & history
- 1900sVolume confirmation is one of the original tenets of Dow Theory — a trend is more trustworthy when volume expands in its direction.
- 1910s+Richard Wyckoff built volume into a complete method: his law of “effort vs. result” reads volume as effort and the resulting price move as the result — a mismatch signals a change.
- 1963Joseph Granville introduced On-Balance Volume (OBV), one of the first formal volume indicators, popularizing the idea that “volume precedes price.”2
How it works
The core readings are simple:
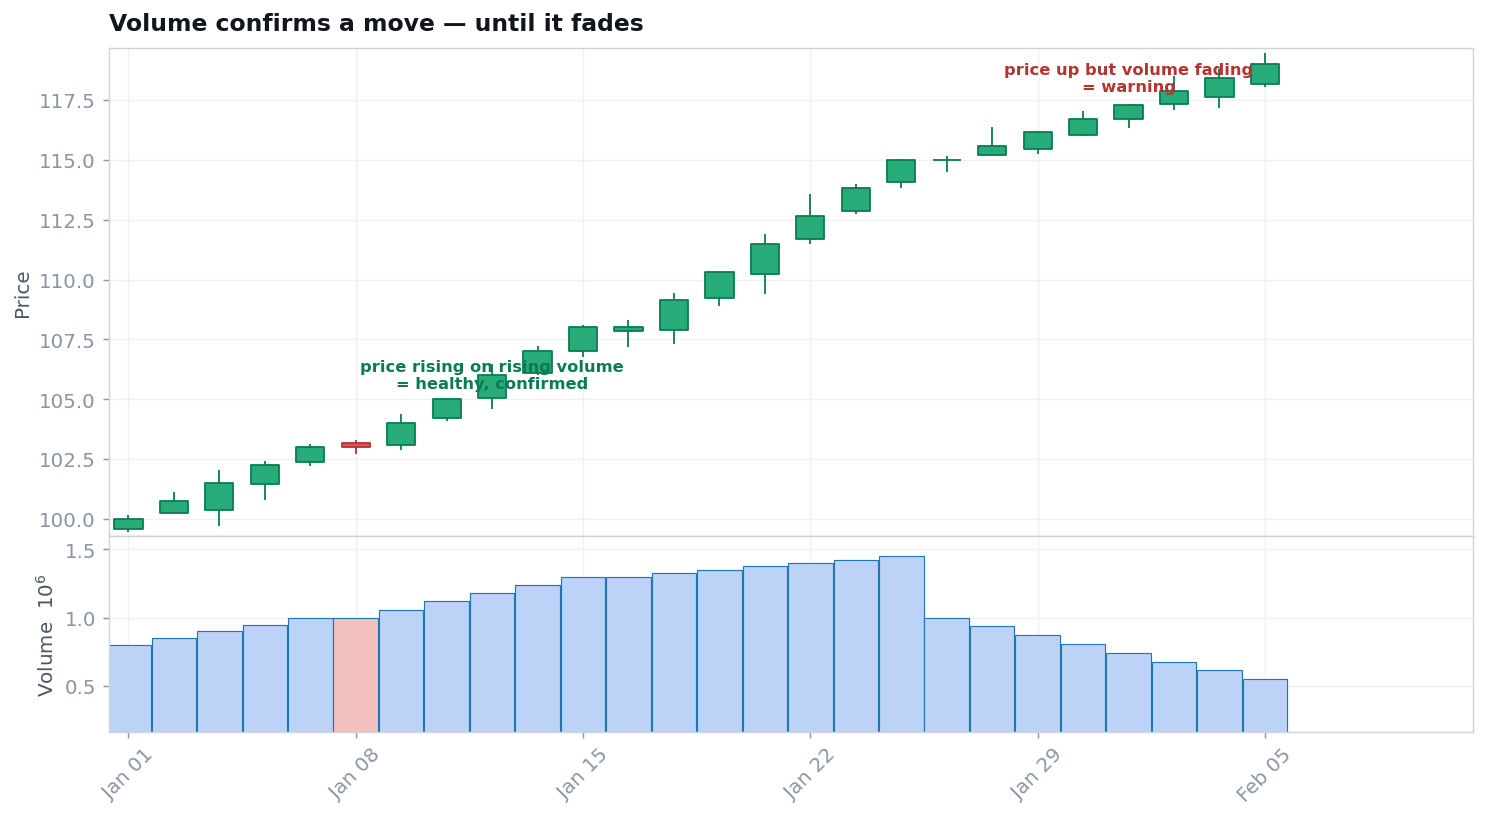
- ·Confirmation. Rising volume in the direction of a move (a breakout, a trend leg) signals real participation.
- ·Relative volume (RVOL). Today's volume versus the typical volume for this time of day — the single best “is this stock in play?” filter.
- ·Climax. A sudden volume spike after a long move often marks exhaustion — a buying or selling climax near a turn.
- ·Distribution by price. Volume-by-price / volume profile shows where the volume traded, marking accepted value and thin zones.
Market psychology & mechanics
A subtle but crucial point: every trade has a buyer and a seller, so volume itself has no direction — there is always exactly as much “buying” as “selling.” What matters is aggression: whether buyers are lifting offers (driving price up) or sellers are hitting bids (driving it down), and how many participants are willing to transact at all. High volume means many participants and strong conviction; it is the crowd voting with size. Wyckoff's insight was that large effort with little result (heavy volume, price barely moves) reveals a big player absorbing the other side — often just before a reversal.
Honest assessment
Strengths
Volume confirms moves, flags exhaustion climaxes, and — through relative volume — identifies the handful of names actually worth trading. It is the foundation of order-flow reading and of VWAP.
The evidence
The price–volume relationship is one of the most studied in finance. Karpoff's landmark 1987 survey established two robust empirical findings: volume is positively related to the magnitude of the price change, and in equity markets, to the direction of the change as well (volume tends to be heavier in advances).1
Evidence rating: the volume–volatility link is strong and well-replicated. Volume as a standalone timing signal is weaker — its value is as confirmation and context.
Weaknesses & failure modes
- FRAGMENTEDModern volume is fragmented. A large share of trading happens off-exchange (dark pools, internalizers), so reported volume can understate true activity.
- AMBIGUOUSHigh volume is two-sided. A volume surge can be heavy accumulation or heavy distribution — you need price context to tell which.
- FXNo true volume in FX. Spot forex is decentralized, so “volume” is only a broker's tick proxy, not consolidated.
- CONTEXTNot a signal alone. Volume confirms; it rarely triggers by itself.
Professional uses vs. retail misuses
How professionals use it
- RVOL to find stocks in play (see scanning).
- Volume confirmation on breakouts and trend legs.
- Effort vs. result and climaxes to read absorption and exhaustion.
Common retail misuses
- Reading a volume spike as automatically bullish.
- Ignoring that buyers and sellers are always equal in number.
- Trusting FX “volume” as if it were real consolidated data.
Going deeper
Volume tools: On-Balance Volume (Granville), the Accumulation/Distribution line, VWAP, Volume Profile / Market Profile, and Volume Spread Analysis (the Wyckoff/Tom Williams lineage). Multi-timeframe: a volume spike means different things on a 1-minute chart (a single event) versus a weekly chart (a multi-day campaign of accumulation or distribution).
Practice
Quiz 1 — If every trade has a buyer and a seller, how can there be “more buying than selling”?
There can't, in number — buyers and sellers are always equal. What differs is aggression: whether buyers are lifting offers (pushing price up) or sellers are hitting bids (pushing it down). Volume measures participation, not net direction.
Quiz 2 — What does heavy volume with almost no price movement suggest?
Wyckoff's effort vs. result: large effort (volume) producing little result (price) means a big player is absorbing the other side — often a sign of a coming reversal.
Quiz 3 — What is relative volume (RVOL) most useful for?
Spotting which stocks are “in play” today — trading far above their normal volume for the time of day, signalling unusual interest and a likely catalyst.
This concept in the knowledge graph
Resources
- TRADERRichard Wyckoff — effort vs. result.
- CONCEPTOrder flow & VWAP.
- GLOSSARYVolume, relative volume.
References (primary where possible)
- Jonathan M. Karpoff, "The Relation between Price Changes and Trading Volume: A Survey," Journal of Financial and Quantitative Analysis, 1987 — Cambridge Core.
- On-Balance Volume — Joseph Granville (1963) — Wikipedia.