1 The Edge — why it works
Three filters stacked: trend, then timing, then trigger
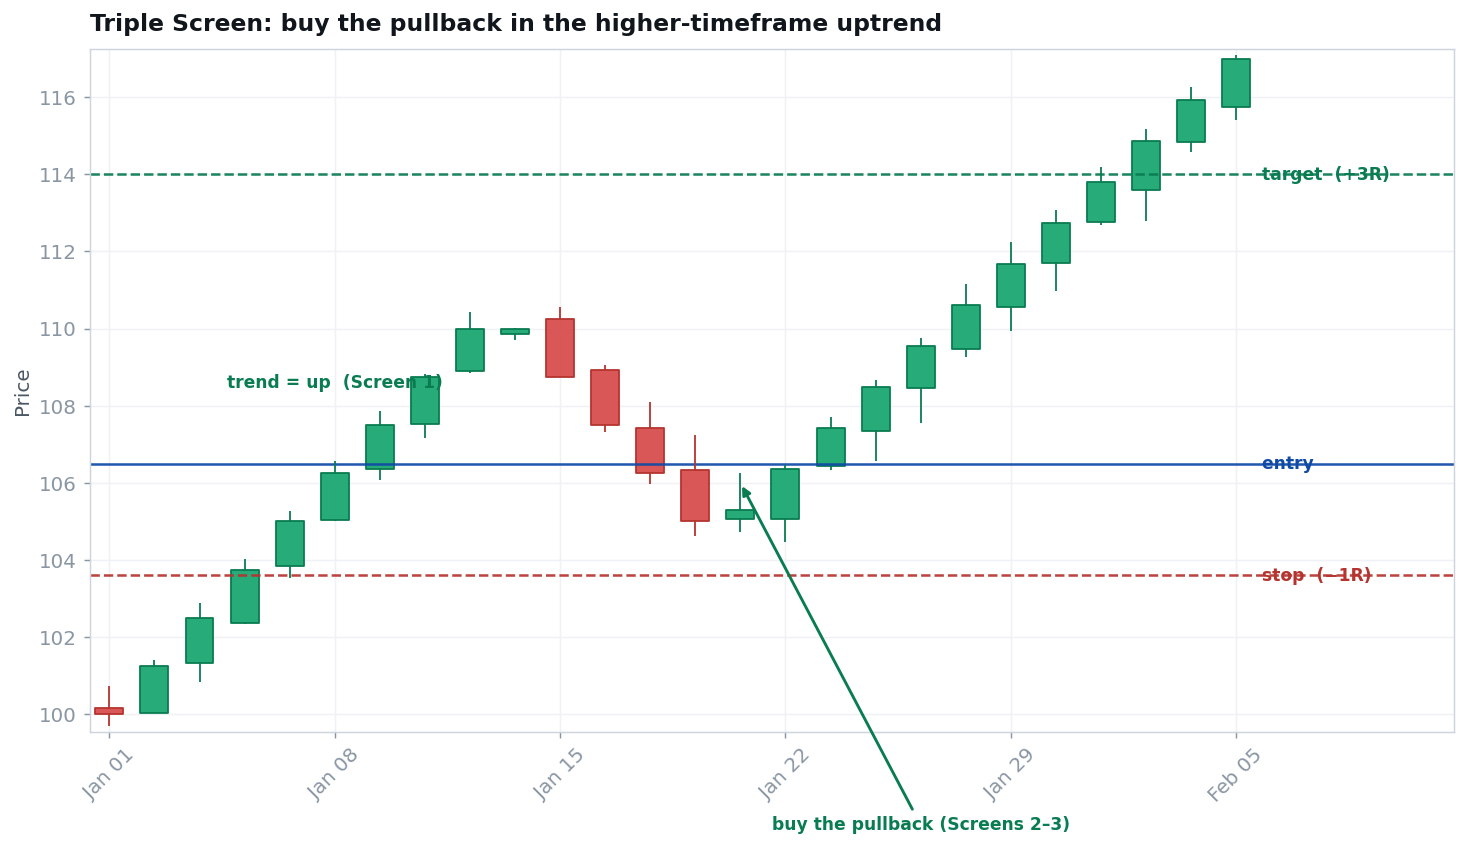
Elder's insight was that a single timeframe lies — an oscillator screaming 'oversold' is a gift in an uptrend and a trap in a downtrend. The Triple Screen forces agreement: Screen 1 reads the trend on the higher timeframe and decides direction; Screen 2 waits for a lower-timeframe oscillator to pull back against that trend; Screen 3 triggers the entry as price resumes. You only ever trade with the bigger trend.
The genius is in the conflict it resolves: you buy the dips (good price) but only when the larger tide is rising (good odds), instead of fighting the trend on an oscillator signal alone.
2 Where it works — and doesn't
Conditions matter more than the pattern
Works best when…
- A clear trend on the higher timeframe (e.g., weekly).
- A lower-timeframe oscillator that swings to an extreme against that trend.
- Liquid markets where pullbacks are orderly.
- Patience to wait for all three screens to align.
Fails / avoid when…
- A flat, directionless higher timeframe (no trend to follow).
- Forcing a long when the higher timeframe is down.
- Choppy markets where pullbacks become reversals.
- Acting on Screen 2 alone, without the trigger.
3 Setup checklist
All true before you act
- ✓Screen 1: a defined trend. The higher timeframe is clearly up or down — that sets your only direction.
- ✓Screen 2: an oscillator pullback. A lower-timeframe oscillator reaches the opposite extreme (oversold in an uptrend).
- ✓Screen 3: a trigger. Price turns back in the trend direction — e.g., a buy-stop above the prior bar's high.
- ✓Direction agreement. You are entering with the higher-timeframe trend, never against it.
4 The process
From signal to managed trade
Entry
In an uptrend, place a buy-stop just above the prior bar's high after the oscillator has pulled back; enter when it triggers.
Stop (1R)
Below the recent pullback low (or the trigger bar's low). Entry − stop = 1R.
Position size
Risk a small fixed % of the account; shares = risk ÷ 1R.
Exit & manage
Target a prior high or a fixed multiple, or trail with the trend. Exit if the higher-timeframe trend rolls over.
5 Worked example (illustrative)
One trade, start to finish, in R
| Account / risk per trade | $25,000 · 1% = $250 |
| Weekly trend | Up — longs only |
| Entry (trigger above pullback) | $48.00 |
| Stop (below pullback low) — 1R | $45.60 · 1R = $2.40/share |
| Position size = $250 ÷ $2.40 | ≈ 104 shares |
| Target (prior high / +2.5R) | $54.00 |
| If it works: +2.5R | + $624 (≈ +2.5%) |
| If it fails: −1R | − $250 (≈ −1.0%) |
6 Honest expectancy
Better odds from alignment
By only buying dips inside an established uptrend, the Triple Screen tilts the odds in your favor without chasing — you get a decent price and the trend at your back at the same time.
Example: win 50% at +2R, lose 50% at −1R → (0.50 × 2) − (0.50 × 1) = +0.5R per trade. The edge collapses if you ignore Screen 1 and fight the trend. An expectation, never a guarantee.
7 Make it yours
Test before you trade
A no-risk validation routine
Pick two timeframes (say weekly and daily). Scroll history: mark where the weekly trend was clearly up, then find each daily oscillator pullback and the trigger that followed. Record entry, the below-pullback stop, and the result in R — before revealing the outcome. Compare with-trend entries to counter-trend ones; the difference is the whole point.
8 Common mistakes
How traders blow this up
- Trading against Screen 1. Buying an oversold reading while the higher timeframe is down is the classic trap.
- Skipping the trigger. Screen 2 is permission, not an entry — wait for price to actually turn.
- No clear higher trend. If Screen 1 is flat, there is no trade.
- Stops in the noise. Place the stop beyond the pullback low, not just under the entry.
- Overstaying. If the higher-timeframe trend ends, the edge is gone — exit.